University of California, San Diego
Files are plotted in Excel with X and Y coordinates for each point/sample on the MDS plots. These plots provide information about how closely or diffusely groups of samples cluster together, viz. gene expression. A useful primer on the principle of multidimensional scaling can be found here.
Information about samples (tumor subtype, whether primary tumor or matched normal etc.) are also provided as needed.
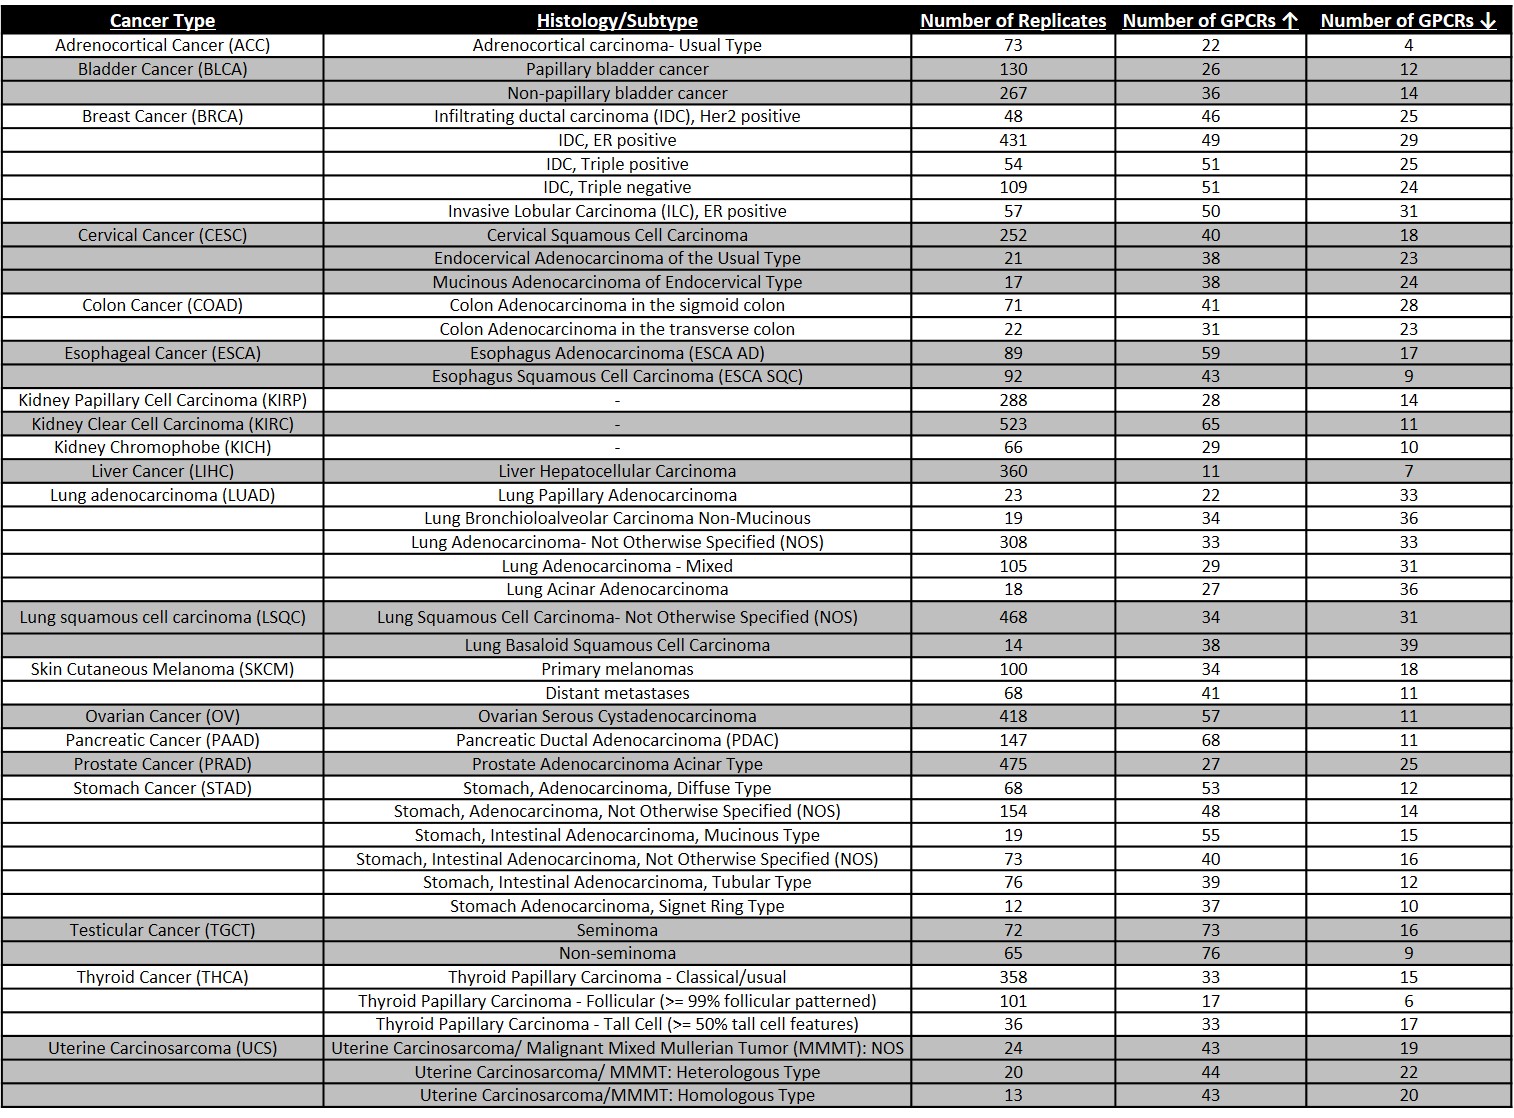
The tumor types below include tumor subtypes as described in Table 1, e.g. the file with Breast Cancer IDC includes Her2+, Hormone Receptor+, Triple + and Triple - subtypes of BRCA IDC.
Adrenocortical Cancer and Adrenal Gland
Breast Cancer Infiltrating Ductal Carcinoma and Breast
Breast Cancer Infiltrating Lobular Carcinoma and Breast
Cervical Cancer and Cervix Uteri
Esophageal Cancer and Esophagus
Kidney Clear Cell Carcinoma and Kidney
Kidney Papillary Cell Carcinoma and Kidney
Liver Hepatocellular Carcinoma and Liver
Lung Squamous Cell Carcinoma and Lung
Skin Cutaneous Melanoma and Sun-exposed skin
Pancreatic Cancer and Pancreas