UCSD Insel Lab
University of California, San Diego
Cancer types and subtypes surveyed for DE analysis
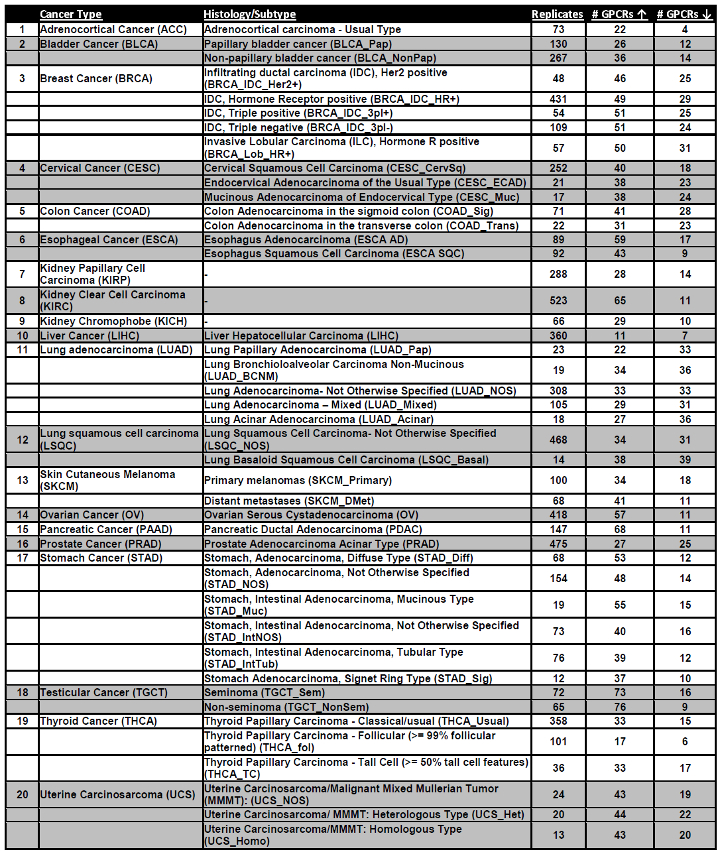
For each tumor type, the number of GPCRs either increased or decreased in expression compared against normal tissue is indicated, along with the number of tumor replicates. For ‘N’s for normal tissue, refer Supplement 1, Table S2.
A list of all target GPCRs annotated by IUPHAR:
This list includes synonyms for Hg19, used for TCGA mutation analysis, and for CNV.
Supplement 2 contains information about which GPCR genes are included in our analysis, the number of GPCRs with non-silent mutations in each TCGA tumor type and the frequency of GPCR Copy-number variation (CNV) in each tumor type.
Supplement 3 contains a master file showing fold changes and magnitude of expression of GPCRs in various tumors, corresponding expression in normal tissue and GPCR expression in cancer cell lines, from the CCLE and Genentech studies hosted at the EBI expression atlas.
Data for specific plots in our paper
The numerical values used to generate several key plots in our manuscript can be downloaded below.
Figure 3A; Figure 3B; Figure 3C; Figure 3D-F
Figure 6B; Figure 6C; Figure 6D; Figure 6F-G
Figure 7A-B; Figure 7C; Figure 7D; Figure 7E; Figure 7G-J
Figure 10A-B; Figure 10C Figure 10D-F
Figure 11A and C; Figure 11B; Figure 11D; Figure 11E; Figure 11F; Figure 11G; Figure 11H; Figure 11I
Figure 13A-D; Figure 13E-F; Figure 13G-H; Figure 13I-J
Figure S3B-C; Figure S3D-F; Figure S3G-I; Figure S3J
Figure S6G-H; SKCM cell lines and tumors
Figure S6G-H; Data from Reeman et al., 2017 for RNA-seq on melanocytes
Figure S8 A, C and D; Figure S8B; Figure S8E-F
Figure S9C; Figure S9D; Figure S9E-F; Figure S9G-H
Figure S12A-B; Figure S12C-D Figure S12E-F
Figure S13, batch corrected and uncorrected CPM expression data in a zip file